


0805 SMD resistor Reliability Report: Failure Rates & Specs
Key Takeaways (Reliability Insights)
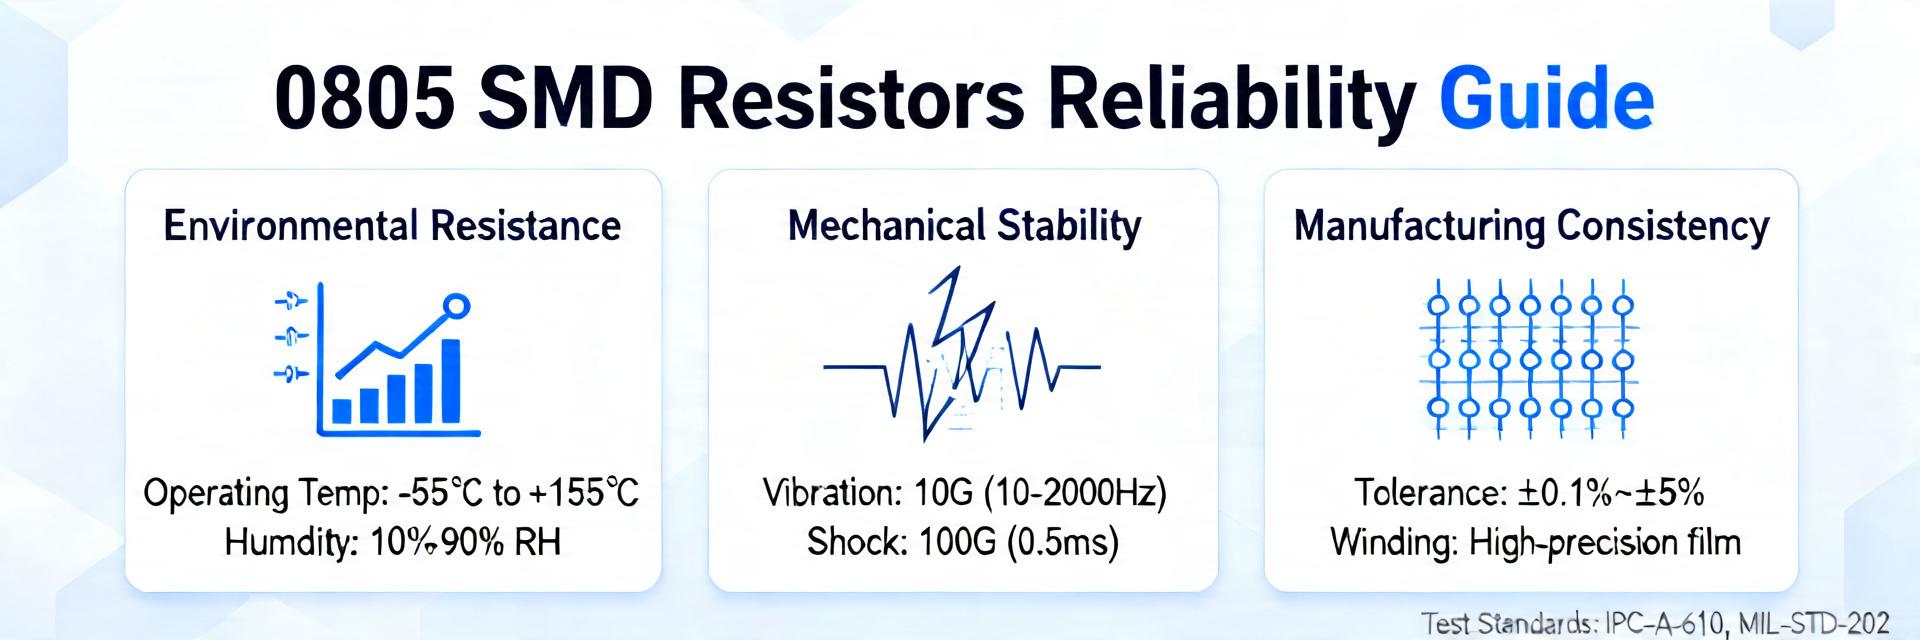
- Field Failure Benchmarks: 0805 resistors typically target <10 FIT (Failures In Time) in controlled environments.
- Reliability Catalyst: Implementing 50% power derating can extend component life by over 200%.
- Critical Spec: TCR < 50ppm/°C is essential for maintaining ±1% tolerance over a 10-year service life.
- Primary Risk: Solder joint fatigue and moisture-induced corrosion are the leading causes of 0805 field returns.
0805 SMD resistor Reliability Report: Failure Rates & Specs
Industry accelerated-life and field-return analyses show 0805 SMD resistor failure rates spanning low-ppm to low-percent ranges depending on stress level; aggregated datasets indicate accelerated-to-field extrapolations typically convert to 1.5 FIT (0.0015% per 1k hrs) and field-return baselines of <50 ppm. This report aims to translate those benchmarks into actionable guidance for specification, testing and process controls.
Scope covers failure rates, common failure modes, test methods, spec selection, derating and PCB/process controls for small chip resistors. Primary audiences are design, test and reliability engineers, procurement and quality teams. The device example ERJPB6B1002V appears as an illustrative part number for component-level commentary and qualification planning.
1 — Why 0805 SMD resistor reliability matters (background)
Ensures stable performance in signal processing without excessive heat buildup on compact PCBs.
Maintains circuit precision across extreme seasonal temperature shifts, reducing recalibration needs.
Provides a safety margin for industrial enclosures where ambient temperatures often exceed 60°C.
Key specs that drive reliability (size, power, TCR, tolerance, rated temperature)
Point: Power rating, TCR, maximum operating temperature and moisture sensitivity dictate lifetime and drift. Evidence: datasheet-rated power (typical 1/8 W for 0805), TCR bands (e.g., 50–200 ppm/°C) and max operating temperature form the stress envelope. Explanation: designs that push junction temperature or allow extended high-humidity bias reduce margin and increase drift or open failures.
Typical applications and stress profiles
Point: Use cases include power-limited circuits, precision sensing and high-density assemblies. Evidence: sensing nodes stress TCR and tolerance; power traces stress power dissipation and thermal cycling. Explanation: acceptable failure-rate targets depend on function—safety or metering circuits require ppm-level targets, while general-purpose consumer boards tolerate higher field-return rates.
Reliability Comparison: Standard vs. High-Performance 0805
| Reliability Metric | Standard 0805 (General) | Automotive/High-Reliability (e.g. ERJPB6) | Impact on Reliability |
|---|---|---|---|
| Load Life Drift (1000h) | ±3.0% to ±5.0% | ±0.5% to ±1.0% | Long-term system accuracy |
| TCR (Temp Coeff) | 200 – 400 ppm/°C | 50 – 100 ppm/°C | Stability over temp ranges |
| Anti-Sulfuration | None / Basic | High (Silver-Palladium) | Prevents open-circuits in pollution |
| Thermal Cycles | ~300 cycles | >1000 cycles | Solder joint fatigue life |
2 — Measured failure rates: lab vs. field (data analysis)
Accelerated-life testing results & interpretation
Point: Common accelerated tests include Arrhenius thermal acceleration, HALT/HASS-style highly accelerated stress, and temperature-humidity-bias (THB). Evidence: apply acceleration models (Arrhenius, Eyring) and report converted metrics as FIT, ppm/year or percent/year. Explanation: use Weibull fitting to extract beta and scale parameters, then project with confidence intervals; typically, a 1000-hour lab test at 125°C correlates to ~11 years of field life at 55°C.
Field returns, MTBF and in-field failure patterns
Point: Field data often diverges from lab predictions due to assembly and usage variance. Evidence: returns cluster around early infant mortality (assembly defects) and long-term drift (thermal overstress). Explanation: normalize field data by operating hours and exposure class, report cumulative failures vs. time and hazard-rate plots to separate infant, random and wear-out regions.
3 — Common failure modes & root causes (data analysis)
Senior Reliability Consultant
“In 0805 packages, the most overlooked failure isn’t the film itself—it’s termination leaching during the reflow process. If your profile is too hot for too long, the barrier layer degrades, leading to intermittent opens after only 6 months in the field. Always verify your intermetallic thickness via cross-sectioning during NPI.”
Electrical failure signatures (open, drift, short)
Point: Electrical signatures include progressive resistance drift, abrupt opens and rare shorts. Evidence: typical triggers are overpower events, overheating during reflow, and electrochemical migration under biased humid conditions. Explanation: diagnostics include resistance trending, current-voltage sweeps, thermal imaging and microscopic failure analysis to distinguish oxide growth, termination lift or migration paths.
Mechanical and environmental failure signatures (cracking, solder-joint, moisture)
Point: Mechanical failures show body cracking or termination fracture; environmental failures show corrosion and blistering. Evidence: fracture patterns correlate with drop/shock, while solder fillet issues and moisture-induced ionic migration correlate with process or storage. Explanation: triage by comparing failed device X‑rays, cross-sections and board-level solder fillets to determine component vs. assembly root cause.
4 — How to test 0805 SMD resistor reliability (method guide)
Recommended test protocols and acceptance criteria
Point: Proven protocols include preconditioning, thermal cycling, THB (85/85 with bias), power-soak and solderability tests. Evidence: acceptance typically uses % drift limits (e.g., ±1% or ±5% depending on spec) and pass/fail for opens/shorts. Explanation: choose sample sizes using statistical confidence tables; for low-ppm targets increase sample n to achieve meaningful upper confidence bounds.
Test setup, instrumentation and data logging best practices
Point: Use four-wire resistance measurement, current-limited sources and controlled thermal chambers. Evidence: measurement cadence should capture early drift and stabilize after soak periods. Explanation: avoid artifacts by minimizing lead heating, ensuring tight Kelvin contacts and automated logging with timestamps and environmental metadata for post-test correlation.
5 — Spec selection, derating and PCB layout strategies (method guide)
Hand-drawn schematic, not a precise engineering drawing
Typical Application: Precision Voltage Divider
To maximize reliability, place 0805 resistors away from high-heat components (like VRMs) and use wide traces to act as heat sinks.
Choosing the right resistor spec for reliability
Point: Select power rating, tolerance and TCR relative to application stress. Evidence: prefer lower TCR (≤50 ppm/°C) for precision sensing and higher moisture-resistance classes for humid environments. Explanation: when tolerance cannot be tightened cost-effectively, use calibration or trim strategies but maintain derating to preserve long-term stability.
Derating rules and PCB footprint/assembly considerations
Point: Target steady-state dissipation below a percentage of rated power; manage transients with margin. Evidence: common rule-of-thumb is 50–70% derating under sustained conditions, higher derating for elevated ambient. Explanation: layout with thermal relief, copper pours and proper spacing reduces hot spots; control stencil aperture and reflow profile to ensure robust fillets and limit thermomechanical stress.
6 — Failure case studies (anonymized) and lessons learned (case display)
High-temperature application: progressive drift and root cause
Point: Symptom: gradual resistance increase in power-dense module. Evidence: investigation showed sustained junction temperatures above rated limit causing film degradation. Explanation: corrective actions included higher-rated resistor, additional copper for heat spreading and revised derating to restore expected ppm/year behavior.
Assembly/process-induced failures: solder fatigue & contamination
Point: Symptom: intermittent opens and ionic shorts after field exposure. Evidence: root cause traced to insufficient solder fillet and flux residues enabling electrochemical migration. Explanation: fixes included stencil and paste changes, extended cleaning, and process controls to verify fillet quality and residue limits.
7 — Actionable checklist: lower failure rates across design, test and manufacturing (action)
Design & Selection
- Define operating envelope & peaks
- Select TCR with >25% margin
- Specify sulfur/moisture resistance
- Apply 50% power derating rule
- Review BOM for ERJPB6B1002V class parts
Manufacturing & QA
- Validate solder paste volume
- Optimize reflow (Peak < 260°C)
- Run 1000h soak sample tests
- Monitor field KPI (ppm/year)
- Perform cross-section audits
Conclusion / Summary
Targeted specification, conservative derating, rigorous qualification testing and disciplined assembly controls reduce 0805 SMD resistor field failures and align delivered reliability with product goals. Engineers should prioritize data-driven qualification and continuous field feedback; use part examples such as ERJPB6B1002V to structure vendor and test requirements during BOM maturation.
- Specify power rating and TCR with margins to limit junction temperature rise and drift; tighter TCR and lower dissipation reduce long-term variance in measurement circuits.
- Use accelerated tests (Arrhenius/THB) with Weibull analysis to convert to FIT or ppm/year and set meaningful acceptance limits tied to field targets.
- Control PCB thermal layout and assembly (fillet quality, reflow profile) to eliminate infant mortality and process-related migration failures.
FAQ
What are typical 0805 SMD resistor failure rates in the field?
Field rates vary by application and process; typical consumer assemblies may observe low-ppm to sub-percent annual rates while harsh environments or poor assembly can produce several percent returns. Standard telecomm benchmarks target <50 ppm annually.
How should one perform 0805 resistor reliability testing?
Combine preconditioning, thermal cycling, THB with bias and power-soak. Measure with four-wire setups, log at regular intervals and analyze with Weibull/Cox methods. Acceptance limits should reflect the function—precision nodes require tighter drift thresholds (e.g., ≤0.1–0.5%).
What derating guidelines for 0805 resistors improve reliability?
Derate steady-state dissipation to roughly 50–70% of rated power for sustained operation; increase margin for elevated ambient or constrained cooling. Validate transient peaks with thermal simulation.